  1. Research topics/

Mobile health

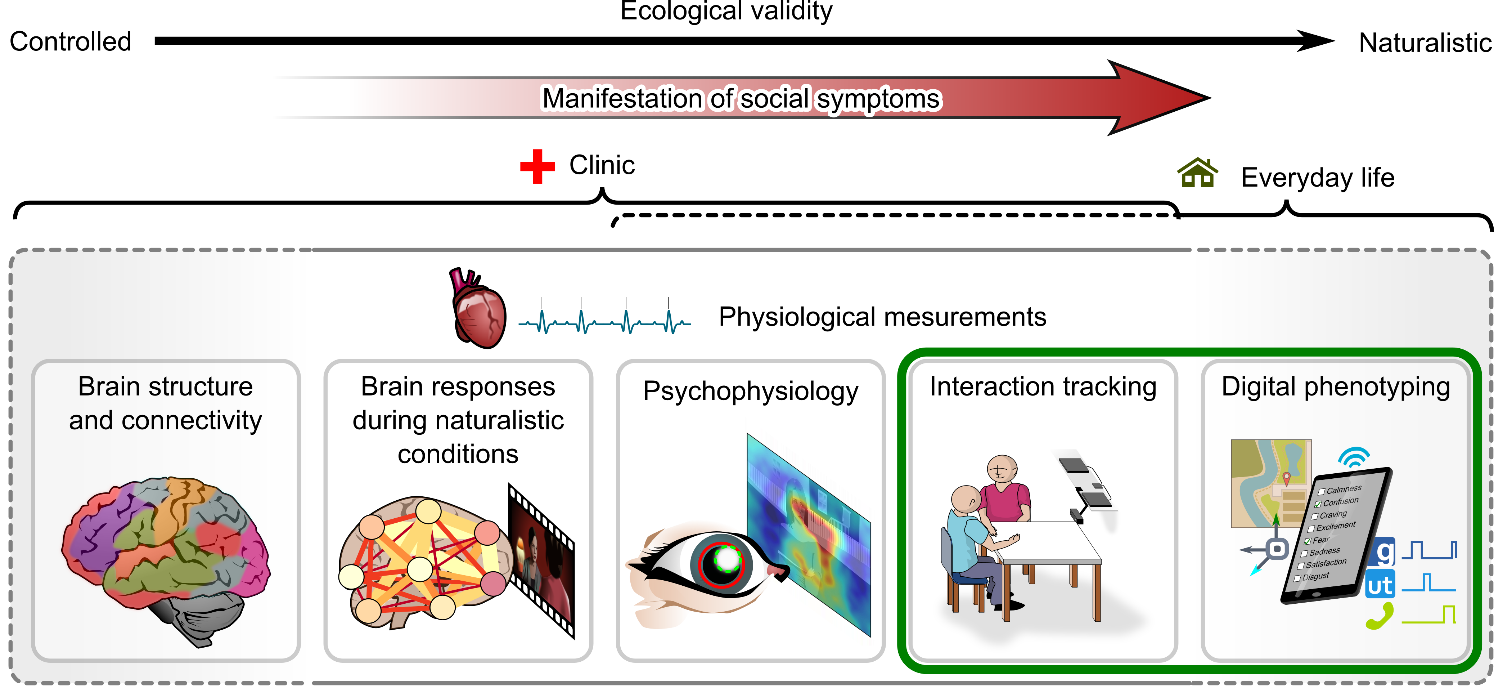
Wireless and mobile technologies can be used to improve health-related research, care and health status. Mobile health (mhealth) makes it possible to collect ecologically valid data without direct medical contact in the patient’s familiar environment - more regularly and many times more than would be possible in conventional clinical examination settings. A connection between patient and doctor is made possible without both having to be in the same place. This data provides doctors with valuable information for the care of their patients.

Flowchart illustrating decentralized monitoring and analysis of biomarkers for medical decision-making. From left to right, the four boxes show 1) a person whose heart and respiratory rate, movement, temperature and blood pressure are measured with digital sensors; 2) a diagram illustrating the transfer of data from a smartphone to the Internet via a cellular network, Wi-Fi and a laptop; 3) a flowchart of the data management process including collection, pre-processing, analysis and decision making; and 4) the potential applications of this process for use by emergency responders, medical personnel and family members.
Decentralized Monitoring and Analysis of Biomarkers

But science can also benefit: Novel biomarkers can be developed from mhealth data to improve the diagnosis, prognosis and monitoring of disease progression. This is an important step towards developing successful treatment options for neuropsychiatric disorders.

An illustration of different methods for measuring physiological and behavioral aspects of social symptoms across a continuum of ecological validity, ranging from controlled to naturalistic settings. At the top, a horizontal arrow represents ecological validity, with “Controlled” on the left and “Naturalistic” on the right. A red arrow labeled “Manifestation of social symptoms” spans from controlled to naturalistic conditions. Below, a clinic icon marks clinical settings, while a home icon represents everyday life. The diagram categorizes physiological measurements into five sections (from left to right): 1) Brain structure and connectivity – illustrated with a colored brain; Brain responses during naturalistic conditions – shown with a brain network and a video reel; Psychophysiology – represented by an eye-tracking heatmap; Interaction tracking – depicted by two people at a table, one with a device; Digital phenotyping – visualized with a mobile device showing different emotional states and a GPS map. The last two categories, “Interaction tracking” and “Digital phenotyping,” are highlighted with a green outline, suggesting a focus on these methods.
Multimodal Data